
From Scripts to Scalable Systems: Building a Production-Ready DevOps Platform with Kubernetes, CI/CD & Observability

Modern software isn’t just about writing code — it’s about building systems that run reliably, scale effortlessly, and recover automatically.
But here’s the reality most tutorials don’t tell you:
You can write a working application… and it can still fail in production.
Why?
Because real-world systems demand more than just functionality:
They need automation (CI/CD)
They need orchestration (Kubernetes)
They need observability (metrics, logs, alerts)
And most importantly — they need resilience
So instead of stopping at “Hello World,” this project takes a different path.
A microservices architecture (API + worker + Redis)
Managed first with system-level services, then evolved into Docker + Kubernetes
Automated using CI/CD pipelines
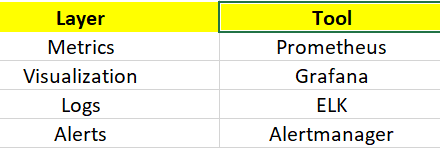
Made observable with Prometheus, Grafana, and ELK
And finally, made reliable with SRE-grade alerting strategies
This isn’t just a project.
It’s a blueprint of how modern backend systems actually run in production.
By the end, you won’t just understand tools — you’ll understand how everything connects.
What We’re Building
We’ll create:
A Python script (your custom daemon)
A systemd service file
Enable it to run at boot
Manage it like a real production service
️ Step 1: Create Your Daemon Script
Create a simple script:
sudo nano /usr/local/bin/mydaemon.pyPaste this:
import time

while True:
    with open(”/tmp/mydaemon.log”, “a”) as f:
        f.write(”Daemon running...\n”)
    time.sleep(5)
Make it executable:
sudo chmod +x /usr/local/bin/mydaemon.pyHow This Service Will Work
systemd
   ↓
Service Unit File
   ↓
ExecStart → Python Script
   ↓
Runs in Background (Daemon)
   ↓
Writes logs continuously
Step 2: Create systemd Service File
Now create the service definition:
sudo nano /etc/systemd/system/mydaemon.servicePaste this:
[Unit]
Description=My Custom Python Daemon
After=network.target

[Service]
ExecStart=/usr/bin/python3 /usr/local/bin/mydaemon.py
Restart=always
User=root

[Install]
WantedBy=multi-user.target
Understanding the Service File
Unit
Metadata and dependencies
After=network.target→ starts after network is ready
Service
ExecStart→ command to runRestart=always→ auto-restart if it crashesUser=root→ runs as root (⚠️ not always recommended)
Install
Defines when service should start
multi-user.target→ normal system boot
Step 3: Reload systemd
After creating a new service:
sudo systemctl daemon-reexec
sudo systemctl daemon-reload
Step 4: Start the Service
sudo systemctl start mydaemonCheck status:
sudo systemctl status mydaemonStep 5: Verify It’s Working
Check logs:
cat /tmp/mydaemon.logYou should see:
Daemon running...
Daemon running...
Step 6: Enable at Boot
sudo systemctl enable mydaemonNow your daemon:
Starts automatically on reboot
Runs continuously
Step 7: Debugging & Logs
Use:
journalctl -u mydaemonThis shows:
Errors
Restart attempts
Runtime logs
Production Best Practices
Avoid:
Running everything as root
Instead:
User=ubuntu
Group=ubuntu
Add Resource Limits
LimitNOFILE=4096Add Restart Control
Restart=on-failure
RestartSec=5
Advanced: Full Production-Ready Service
[Unit]
Description=My Production Daemon
After=network.target

[Service]
ExecStart=/usr/bin/python3 /usr/local/bin/mydaemon.py
Restart=on-failure
RestartSec=5
User=ubuntu
WorkingDirectory=/usr/local/bin
StandardOutput=journal
StandardError=journal

[Install]
WantedBy=multi-user.target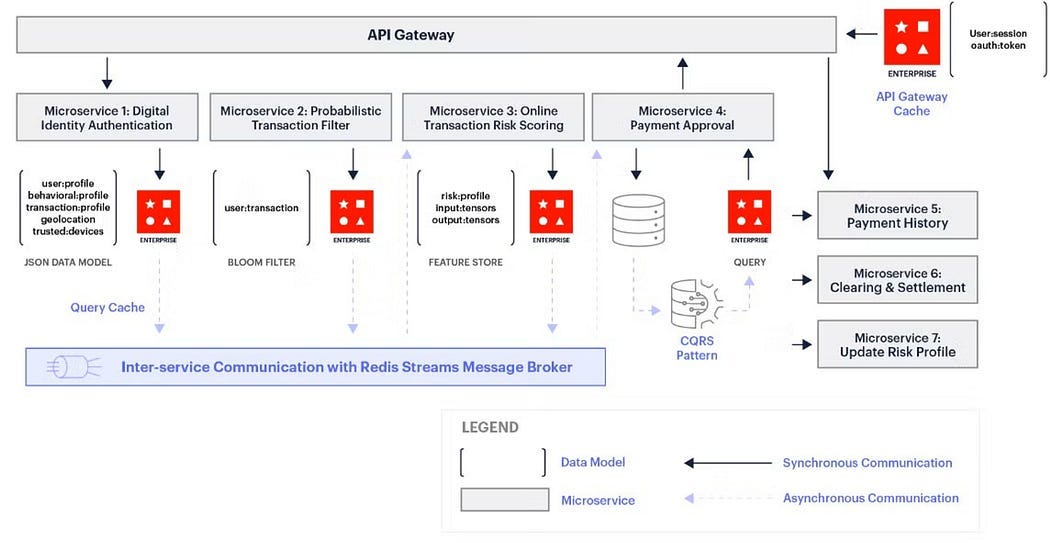
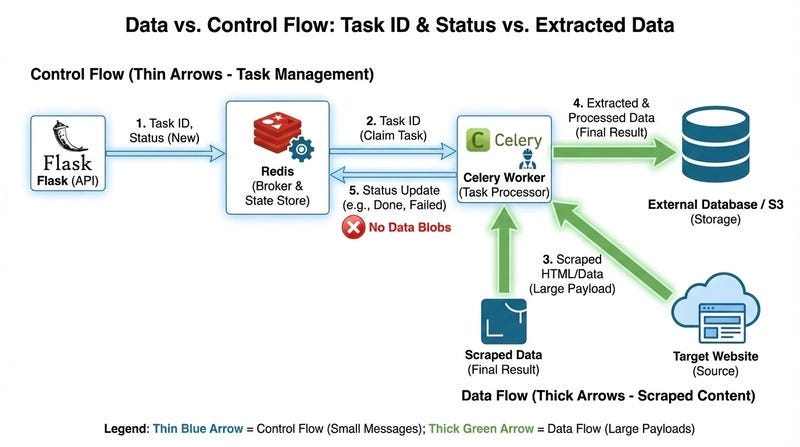
Flow:
API receives request
Pushes job to Redis
Worker consumes job
Processes and logs result
This is how real async systems work.
Step 1: Install Dependencies
sudo apt update
sudo apt install python3-pip redis -y
pip3 install flask redis
Step 2: Build Services
1. API Service (Flask)
sudo nano /usr/local/bin/api_service.pyfrom flask import Flask, request
import redis
app = Flask(__name__)
r = redis.Redis(host=’localhost’, port=6379)
@app.route(’/task’, methods=[’POST’])
def task():
data = request.json.get(’data’)
r.lpush(’queue’, data)
return {”status”: “queued”}
app.run(host=’0.0.0.0’, port=5000)2. Worker Service
sudo nano /usr/local/bin/worker_service.pyimport redis
import time
r = redis.Redis(host=’localhost’, port=6379)
while True:
_, task = r.brpop(’queue’)
print(f”Processing: {task.decode()}”)
time.sleep(2)3. Redis Service
Redis is already a daemon. You just enable it:
sudo systemctl enable redis
sudo systemctl start redis
Step 3: Create systemd Services
API Service Unit
sudo nano /etc/systemd/system/api.service[Unit]
Description=Flask API Service
After=network.target redis.service
[Service]
ExecStart=/usr/bin/python3 /usr/local/bin/api_service.py
Restart=always
User=ubuntu
[Install]
WantedBy=multi-user.targetWorker Service Unit
sudo nano /etc/systemd/system/worker.service[Unit]
Description=Worker Service
After=network.target redis.service
[Service]
ExecStart=/usr/bin/python3 /usr/local/bin/worker_service.py
Restart=always
User=ubuntu
[Install]
WantedBy=multi-user.targetStep 4: Reload & Start Everything
sudo systemctl daemon-reload

sudo systemctl start api
sudo systemctl start worker

sudo systemctl enable api
sudo systemctl enable worker
Step 5: Test the System
Send request:
curl -X POST http://localhost:5000/task \
-H “Content-Type: application/json” \
-d ‘{”data”:”hello world”}’
Verify Worker Output
journalctl -u worker -fExpected:
Processing: hello worldVisual: Service Interaction
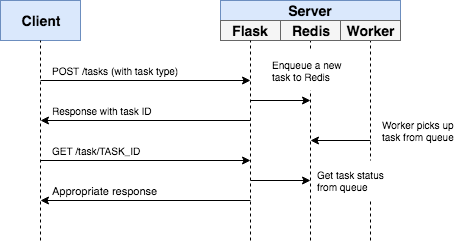
Production Enhancements (DevOps Level)
Add Environment File
Environment=REDIS_HOST=localhostAdd Restart Limits
Restart=on-failure
RestartSec=3
Logging
journalctl -u api
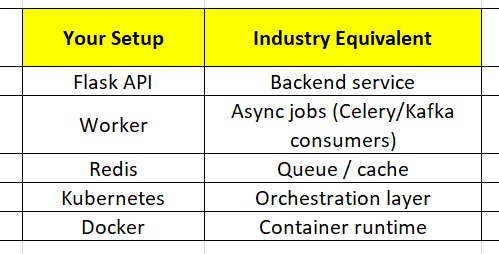
journalctl -u workerReal-World Mapping
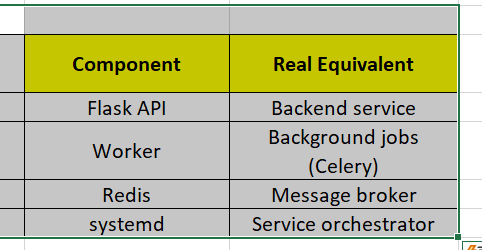
Why This Matters
You just built:
A microservices architecture
With async processing
Managed by system-level orchestration
This is exactly how:
Payment systems
Notification services
Data pipelines
…are built in production.
Let’s take your microservices setup to production-grade DevOps by adding a CI/CD pipeline using GitHub Actions.
CI/CD Flow
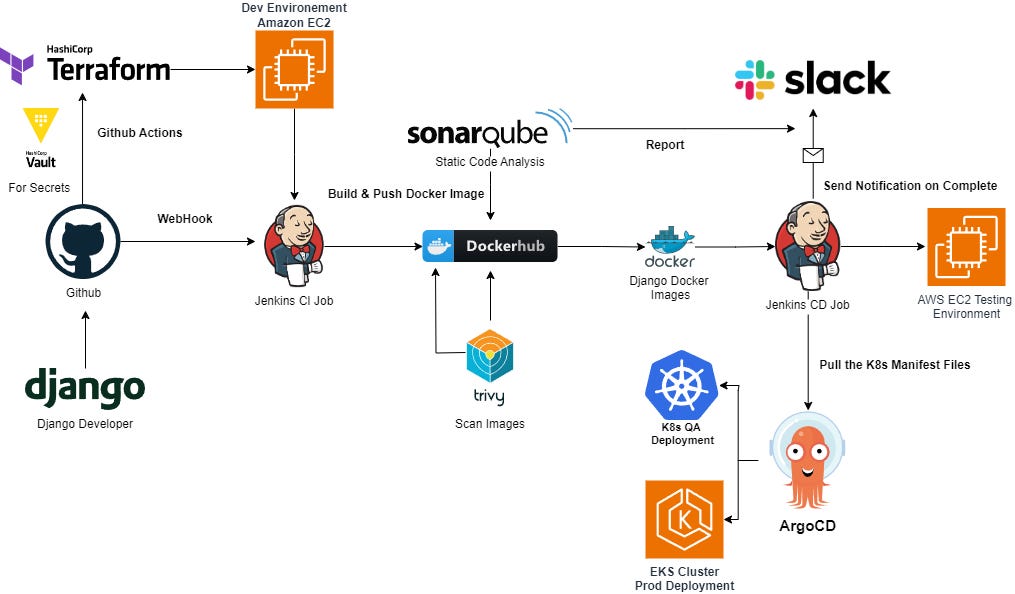
Flow:
Push code to GitHub
GitHub Actions runs pipeline
Connects to server via SSH
Pulls latest code
Restarts systemd services
Step 1: Prepare Your Repo
Your repo structure should look like:
project/
 ├── api_service.py
 ├── worker_service.py
 ├── requirements.txt
 └── .github/workflows/deploy.yml
Step 2: Add Secrets in GitHub
Go to your repo → Settings → Secrets → Actions
Add:
SERVER_IPSERVER_USERSSH_PRIVATE_KEY
These are used for secure deployment.
Step 3: Create GitHub Actions Workflow
mkdir -p .github/workflows
nano .github/workflows/deploy.yml
deploy.yml
name: Deploy Microservices

on:
  push:
    branches:
      - main

jobs:
  deploy:
    runs-on: ubuntu-latest

    steps:
      - name: Checkout Code
        uses: actions/checkout@v3

      - name: Setup SSH
        run: |
          mkdir -p ~/.ssh
          echo “${{ secrets.SSH_PRIVATE_KEY }}” > ~/.ssh/id_rsa
          chmod 600 ~/.ssh/id_rsa
          ssh-keyscan -H ${{ secrets.SERVER_IP }} >> ~/.ssh/known_hosts

      - name: Deploy to Server
        run: |
          ssh ${{ secrets.SERVER_USER }}@${{ secrets.SERVER_IP }} << ‘EOF’
            cd /usr/local/bin
            git pull origin main

            pip3 install -r requirements.txt

            sudo systemctl restart api
            sudo systemctl restart worker
          EOF
What This Pipeline Does
on: push — Triggers deployment automatically on every push to main
Checkout — Pulls your code into the runner
SSH Setup
Injects private key
Establishes trust with server
Deployment Step
SSH into server
Pull latest code
Install dependencies
Restart services
Step 4: Test the Pipeline
Push a change:
git add .
git commit -m “Test CI/CD”
git push origin main
Go to GitHub → Actions tab
You’ll see your pipeline running
Verify Deployment
On your server:
systemctl status api
systemctl status worker
Check logs:
journalctl -u api -f
journalctl -u worker -f
Production Best Practices
Use Non-Root User
Avoid:
User=rootUse:
User=ubuntuAdd Zero-Downtime Restart
systemctl reload apiUse Virtual Environment
python3 -m venv venv
source venv/bin/activate
Update service:
ExecStart=/usr/local/bin/venv/bin/python api_service.pyAdd Health Check Step
You can extend pipeline:
- name: Health Check
  run: |
    curl -f http://${{ secrets.SERVER_IP }}:5000 || exit 1
Advanced Version (Production Ready)
Add rollback logic:
- name: Restart Services Safely
  run: |
    ssh ${{ secrets.SERVER_USER }}@${{ secrets.SERVER_IP }} << ‘EOF’
      sudo systemctl restart api || sudo systemctl rollback api
    EOF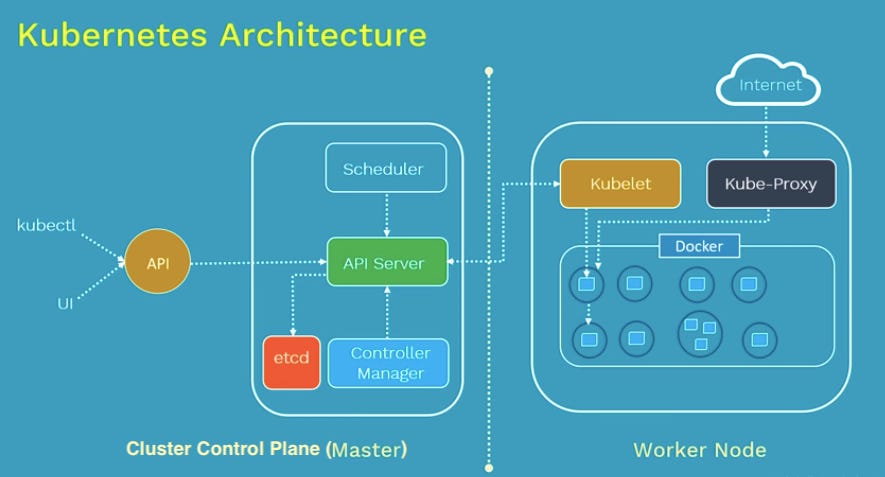
Flow:
API (Flask) → receives request
Sends job → Redis
Worker → consumes job
Kubernetes → orchestrates everything
You’re moving from system-level services → cloud-native architecture
Step 1: Dockerize Your Services
API Dockerfile
# api/Dockerfile
FROM python:3.9-slim

WORKDIR /app

COPY api_service.py.
COPY requirements.txt.

RUN pip install -r requirements.txt

CMD [”python”, “api_service.py”]
Worker Docker file
# worker/Dockerfile
FROM python:3.9-slim

WORKDIR /app

COPY worker_service.py.
COPY requirements.txt.

RUN pip install -r requirements.txt

CMD [”python”, “worker_service.py”]
requirements.txt
flask
redis
Build & Run Locally
docker build -t api-service./api
docker build -t worker-service./worker

docker run -d -p 5000:5000 api-service
docker run -d worker-service
Step 2: Kubernetes Manifests
Redis Deployment
apiVersion: apps/v1
kind: Deployment
metadata:
  name: redis
spec:
  replicas: 1
  selector:
    matchLabels:
      app: redis
  template:
    metadata:
      labels:
        app: redis
    spec:
      containers:
      - name: redis
        image: redis:7
        ports:
        - containerPort: 6379
API Deployment
apiVersion: apps/v1
kind: Deployment
metadata:
  name: api
spec:
  replicas: 2
  selector:
    matchLabels:
      app: api
  template:
    metadata:
      labels:
        app: api
    spec:
      containers:
      - name: api
        image: api-service:latest
        ports:
        - containerPort: 5000
Worker Deployment
apiVersion: apps/v1
kind: Deployment
metadata:
name: worker
spec:
replicas: 2
selector:
matchLabels:
app: worker
template:
metadata:
labels:
app: worker
spec:
containers:
- name: worker
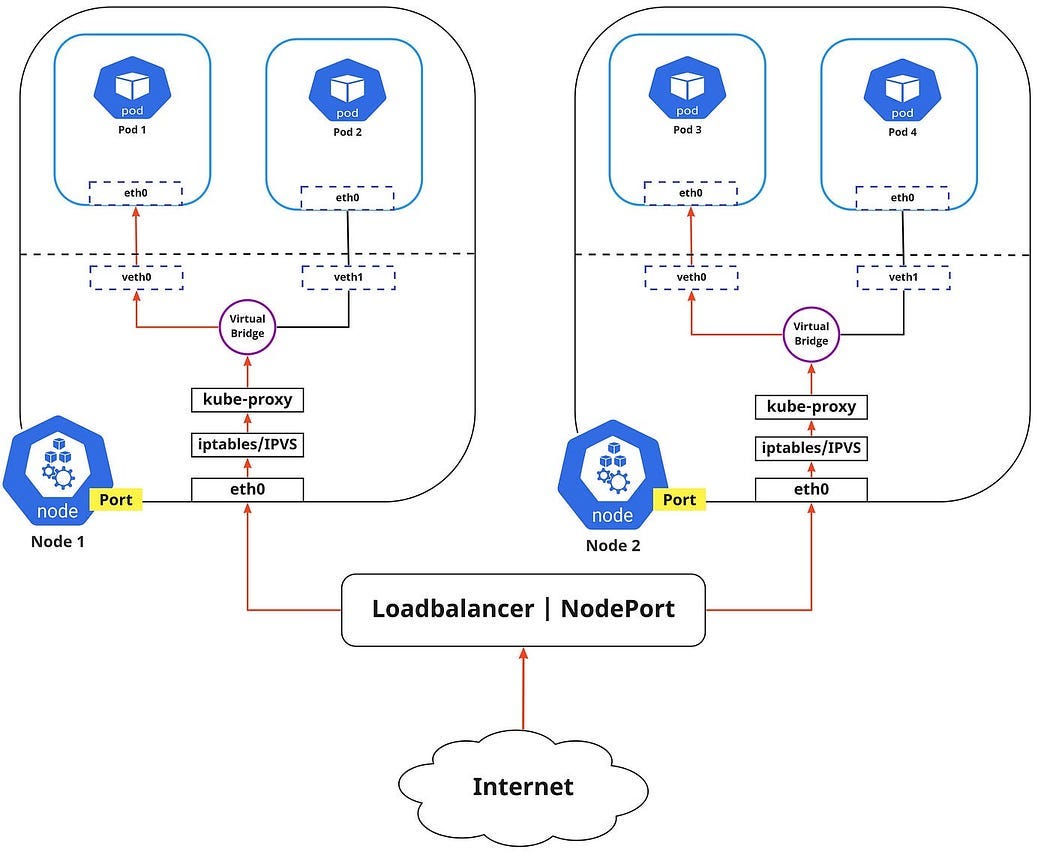
image: worker-service:latestStep 3: Expose API Service
apiVersion: v1
kind: Service
metadata:
  name: api-service
spec:
  type: NodePort
  selector:
    app: api
  ports:
    - port: 80
      targetPort: 5000
      nodePort: 30007
Step 4: Deploy to Kubernetes
kubectl apply -f redis.yaml
kubectl apply -f api.yaml
kubectl apply -f worker.yaml
kubectl apply -f api-service.yaml
Step 5: Test
curl http://<node-ip>:30007/taskVisual: Kubernetes Internals
Production Enhancements
Use Config Map
env:
- name: REDIS_HOST
  value: redis
Add Readiness & Liveness Probes
livenessProbe:
  httpGet:
    path: /
    port: 5000
Use Ingress (instead of NodePort)
Use Persistent Storage (for Redis)
CI/CD Upgrade
Update your GitHub Actions pipeline:
- name: Build Docker Images
  run: |
    docker build -t api-service./api
    docker build -t worker-service./worker- name: Push to Docker Hub

- name: Push to Docker Hub
  run: |
    docker tag api-service your-dockerhub/api-service
    docker push your-dockerhub/api-service

- name: Deploy to Kubernetes
  run: |
    kubectl apply -f k8s/
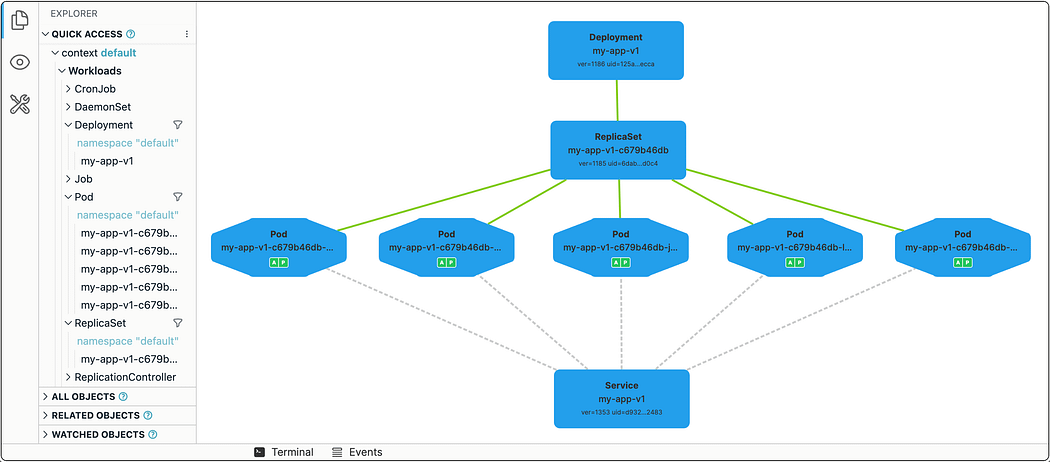
Real Industry Mapping
Flow:
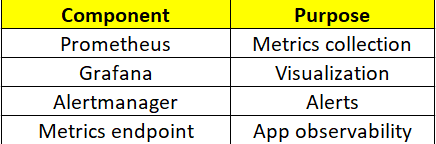
Kubernetes Pods → expose metrics
Prometheus → scrapes metrics
Grafana → visualizes
Alertmanager → sends alerts
This is called Observability Stack
Step 1: Install Prometheus (Kubernetes)
Use Helm (recommended)
helm repo add prometheus-community https://prometheus-community.github.io/helm-charts
helm repo update

helm install prometheus prometheus-community/kube-prometheus-stack
This installs:
Prometheus
Grafana
Alertmanager
Node Exporter
Step 2: Access Grafana Dashboard
kubectl port-forward svc/prometheus-grafana 3000:80Open: http://localhost:3000
Default login:
user:
adminpassword:
kubectl get secret prometheus-grafana \
-o jsonpath=”{.data.admin-password}” | base64 --decode
Step 3: Add Application Metrics
Right now, Prometheus monitors cluster — but not your app.
Let’s fix that
Update API Service (Flask Metrics)
Install:
pip install prometheus_clientUpdate API:
from prometheus_client import Counter, generate_latest
from flask import Response

REQUEST_COUNT = Counter(’api_requests_total’, ‘Total API Requests’)

@app.route(’/metrics’)
def metrics():
    return Response(generate_latest(), mimetype=’text/plain’)

@app.route(’/task’, methods=[’POST’])
def task():
    REQUEST_COUNT.inc()
    ...
Step 4: Expose Metrics in Kubernetes
Update API deployment:
ports:
- containerPort: 5000
Add Service Monitor (CRD)
apiVersion: monitoring.coreos.com/v1
kind: ServiceMonitor
metadata:
  name: api-monitor
spec:
  selector:
    matchLabels:
      app: api
  endpoints:
  - port: http
    path: /metrics
    interval: 15s
Step 5: Create Grafana Dashboard
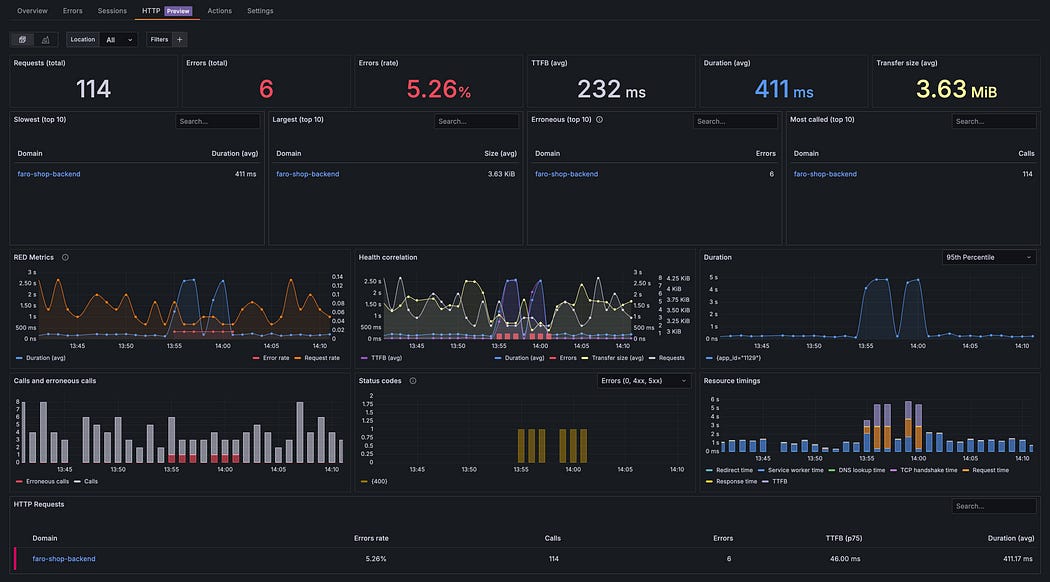
Add Panel Query:
api_requests_totalNow you can see:
Request rate
Traffic patterns
Load spikes
Step 6: Add Alerts
Example Alert Rule
groups:
- name: api-alerts
  rules:
  - alert: HighRequestRate
    expr: api_requests_total > 100
    for: 1m
    labels:
      severity: warning
    annotations:
      description: “High API traffic detected”
Step 7: Configure Alert manager
Example:
receivers:
- name: email-alert
  email_configs:
  - to: your-email@example.com
What You Just Achieved
Real DevOps Insight
This stack is used in:
Netflix
Uber
Swiggy / Zomato
Cloud-native startups
You just built industry-standard observability
Pro-Level Enhancements
Add RED Metrics
Rate
Errors
Duration
Add Latency Metrics
from prometheus_client import Histogram
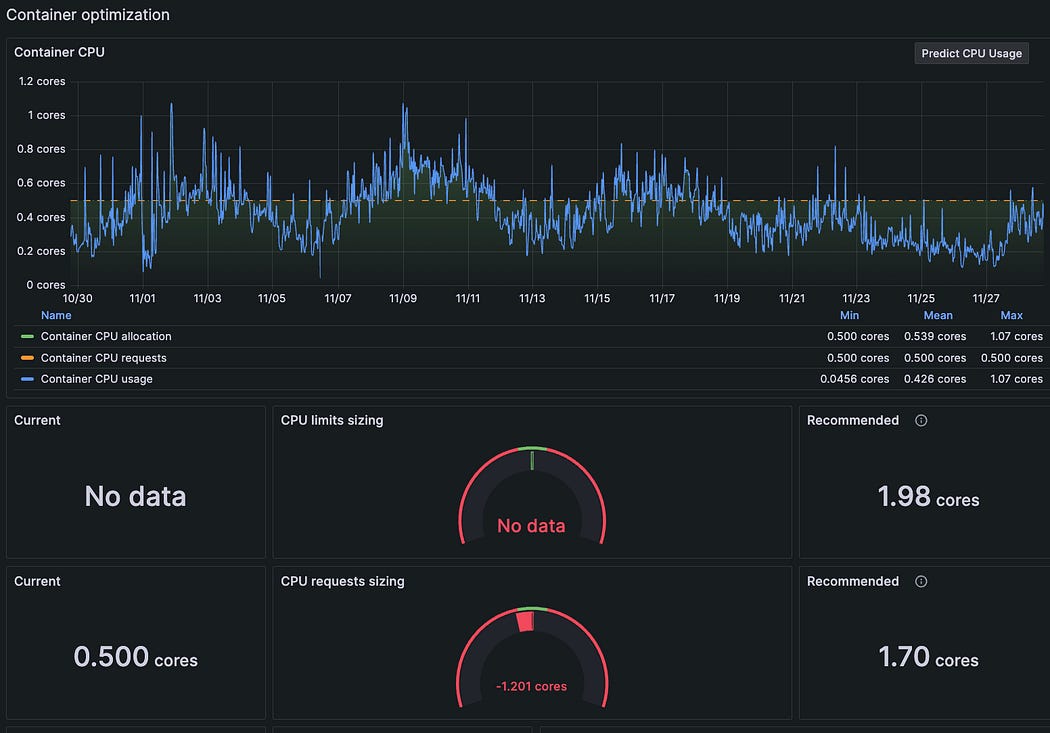
REQUEST_LATENCY = Histogram(’request_latency_seconds’, ‘Request latency’)Add Kubernetes Metrics
Pod CPU
Memory
Restarts
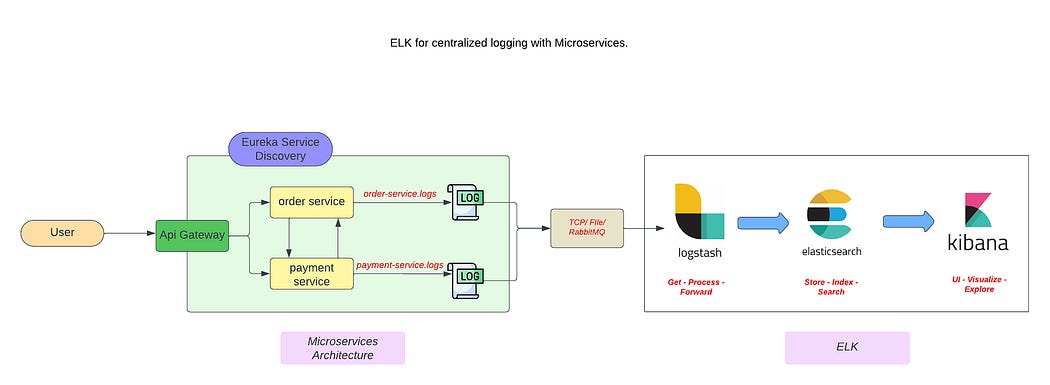
Let’s add centralized logging using the ELK stack:
Elasticsearch → stores logs
Logstash → processes logs
Kibana → visualizes logs
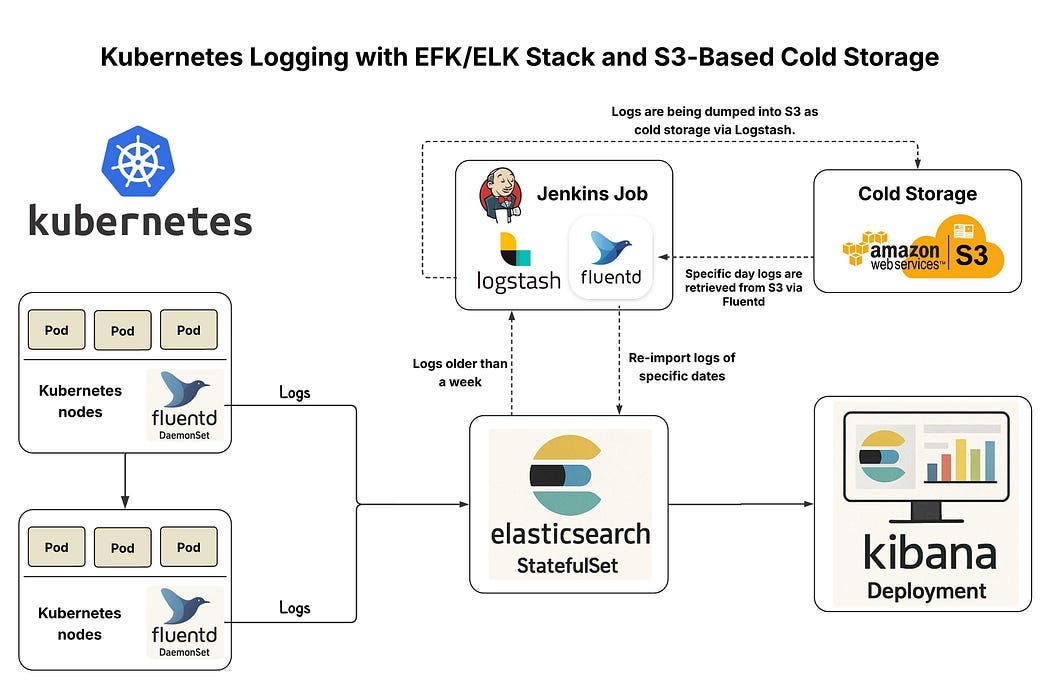
Flow:
Kubernetes Pods → generate logs
Fluent Bit / Logstash → collect & process
Elasticsearch → store
Kibana → visualize
This gives you full log visibility across microservices
Step 1: Deploy ELK Stack (Kubernetes)
Use Helm (Recommended)
helm repo add elastic https://helm.elastic.co
helm repo update

helm install elasticsearch elastic/elasticsearch
helm install kibana elastic/kibana
helm install logstash elastic/logstash
Step 2: Access Kibana
kubectl port-forward svc/kibana-kibana 5601:5601Open: http://localhost:5601
Step 3: Collect Logs from Pods
Kubernetes writes logs to:
/var/log/containers/*.logWe use Fluent Bit (lightweight log collector).
Deploy Fluent Bit
helm repo add fluent https://fluent.github.io/helm-charts
helm install fluent-bit fluent/fluent-bit
Fluent Bit Flow
Pods → stdout logs → Fluent Bit → Elasticsearch → KibanaStep 4: Configure Log Parsing
Example Fluent Bit config:
[INPUT]
    Name tail
    Path /var/log/containers/*.log
    Tag kube.*

[OUTPUT]
    Name es
    Match *
    Host elasticsearch-master
    Port 9200
Step 5: Visualize Logs in Kibana
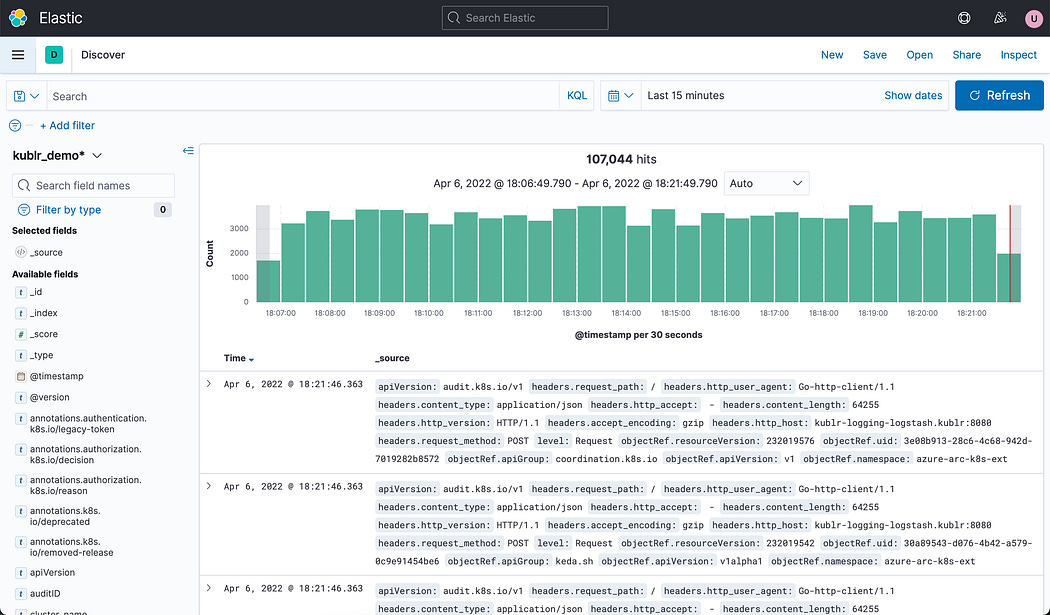
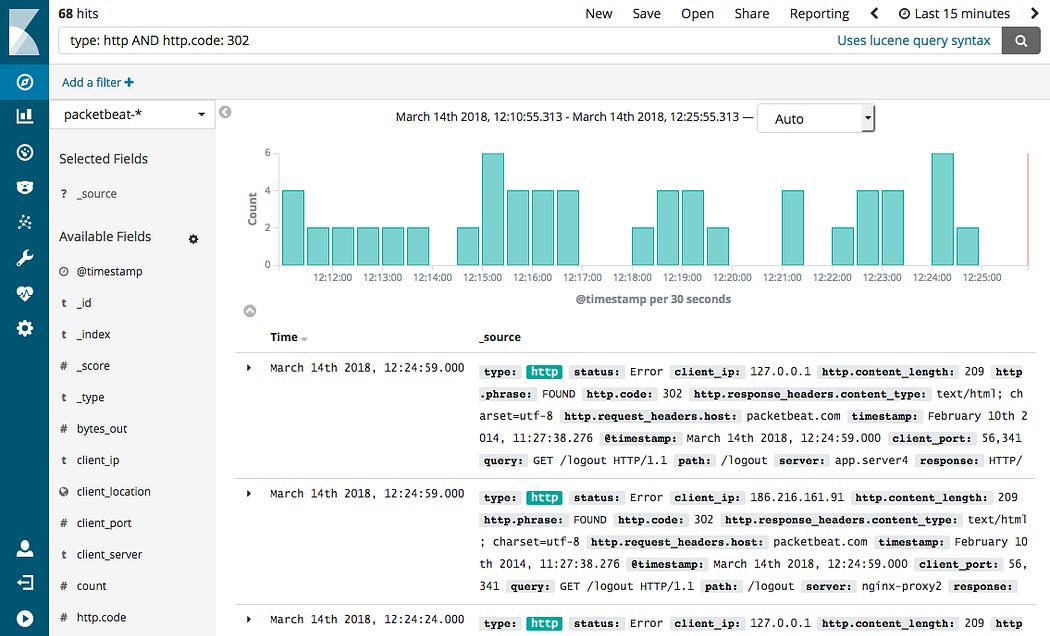
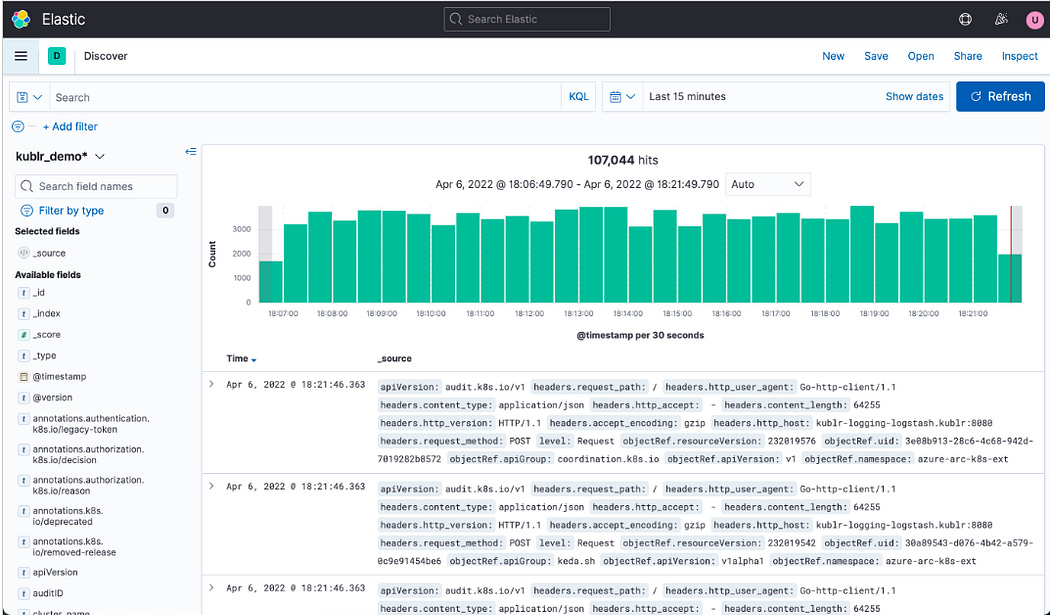
In Kibana:
Go to Discover
Create index pattern:
logstash-*Search logs like:
error OR exceptionStep 6: Add Structured Logging
Update your Python services:
import logging

logging.basicConfig(level=logging.INFO)

logging.info(”Task received”)
logging.error(”Something failed”)
Structured logs = better searchability in Kibana
Step 7: Log-Based Alerts
You can trigger alerts on logs:
Example:
If
"error"appears > 10 times/min → alert
Observability = Logs + Metrics + Alerts
Metrics tell you what is wrong
Logs tell you why it’s wrong
Now — you have both.
What started as a simple service has now evolved into a fully observable, automated, production-ready system.
Let’s step back and look at what you’ve built:
Microservices architecture
Containerized applications using Docker
Kubernetes orchestration
CI/CD pipeline with GitHub Actions
Monitoring with Prometheus & Grafana
Centralized logging with ELK
Intelligent alerting strategies
This is not a beginner setup.
This is the foundation of real-world DevOps and SRE systems.
More importantly, you’ve made a critical mindset shift:
From running applications → to engineering systems
And that’s what separates:
A developer from a DevOps engineer
A learner from a builder
Knowledge from real capability
In production, systems don’t fail because of one bug.
They fail because of missing visibility, weak automation, and poor alerting.
Now — you’ve solved all three.